
This is the first in a series of articles that will look at how we can build a reliable monitoring service that gives us long term metric storage built entirely with open source software and be as cost effective as possible. Whilst it’s not a dependency, this series will assume we’re building on top of a kubernetes stack.
What is Observability
In the CALMS model the M stands for Measurement and in order to measure we need telemetry data. The State of DevOps 2019 report asserts:
Reliability is a critical feature, observability is a necessary component of reliability, and open source tooling is at least A right approach, if not THE right approach.
It seems pretty obvious but it’s worth taking in again. In our quest to build highly reliable systems, we must address observability. So what exactly is observability?
Many opinions have been thrown around with each one differing slightly. There are a few battling definitions around and I don’t intend on definitively adding to the argument over nomenclature.
The way I try and define observability is that is the area of our systems we have the potential to see. We may use different tools for different parts of the system and they can be broken down into three pillars: Metrics, Tracing and Logging.

Together, these discrete pieces of data become telemetry data and we can use this data in many ways - all with the common goal of observing the state of the system at a given point in time. One common use case in kubernetes is to scale a pod or the underlying infrastructure based on fluctuations in demand. Another is for your engineering team to graph (or otherwise visualise) the data so that they can understand the state of the system and respond accordingly.
What is Monitoring
We use a monitoring system (or a number of independent systems) to gather and analyse the telemetry data (the output of each pillar) and create rules around them based on the values which may trigger alerts.
The monitoring system should give us the ability to be able to see the state our system is in with a real time view. We should also be able to retrospectively view the same data through discovery (commonly this occurs when performing a Root Cause Analysis). A monitoring system may be consumed by automated process (such as scaling) or could be used for discovery.
A common implementation would be to create a series of rules around your telemetry data that may trigger alerts. They may trigger automated processes if the arising condition that triggered the rule can be healed without any manual intervention.
Next, let’s break down the features of each data pillar.
Logs

In basic terms, logs are a series of events captured in a message. They can be written to a logfile or they can be piped to a file descriptor such as STDOUT and STDERR. That is the most common pattern for containers where filesystems should be immutable.
In a kubernetes cluster, you will generally have a log scraper (major clouds usually inject their preferred one) and move the logs from a cluster to an external system (AWS have Cloud Watch, GCP have StackDriver logs).
There are many open source log scraping tools and you will commonly see fluentd, logstash and Splunk referred to in this space. Loki is a new contender, having gone GA this week - although to be clear, Loki uses Promtail which would be the equivalent scraper.
Logs can contain rich information about what happened on a system and they are best used in the context of other telemetry data. Logs can adhere to standards, such as the Common Log Format although the format of the data really depends on the intended use case. A web server may emit a series of log lines such as:
10.16.2.1 - - [23/Nov/2019:13:44:26 +0000] "GET /articles/monitoring/monitoring-and-observability/ HTTP/2.0" 200 0 "-" "-" 11985 "webserver-c82ffd883c30f6f20a3c@kubernetescrd" "http://10.16.3.61:3000" 2ms
You can standardise the logs across your own applications based on the detail that you need and any limitations of the language and environment you’re developing in. For example, at UBIO we have the ub-logger library for NodeJS which standardises the logs we collect across all of our Node services.
Metrics

A metric is defined as a system or standard of measurement. We learn about them in school - millimeters, centimeters and meters are a good example of a metrics which obviously measure length.
In computing, metrics are a little less tangible but nonetheless indicative. In our web server, we may have a count of the number of requests we’ve served. We could break that down more and have a metric for the number of requests that were served with a 200 response code.
Log based metrics
If you take another look at the log example above, you can see on the log line a 200 which shows us the same metric - this is a single instance and it follows that a count of 200’s can be inferred from all of our logs.
In Log based metrics (LBM), we would analyse all of the incoming logs and calculate the value that we want (in this case a count of 200’s over time). But this comes at a cost, and is not encouraged where it can be avoided (primarily, if you have the ability to change the application) due to the demands and delays required ingesting and processing all of the data required to derive the metric value.
Native metrics
The alternative to LBM is to natively collect and expose the target metrics you want to measure from your application. This may be held in memory or it may be persisted, it doesn’t really matter. The key detail here is that we do not, on the receiving side, have to process a large volume of data and throw most of it away to see the health of our system.
If we were to store the response code when a request is served, we can build a simple counter that would allow us to access the full picture of our webserver:
SERVER_SUM 150
SERVER_200 117
SERVER_418 30
SERVER_500 3
Our monitoring system then simply needs to get access to this information (which is why our application should expose them) and can make decisions in a much faster manner.
Within the open source metrics domain, you will commonly encounter Prometheus and Graphite. This series of articles will focus on Prometheus.
Traces

Tracing (also known as spanning) is data that shows timing data across applications or systems. An incoming request to a webserver may be forwarded on to a backend server. Tracing would capture the data around that request such as the amount of time it took the backend server to respond to the frontend.
OpenTracing provides a set of API’s for instrumenting your own applications and all of the major visualisation tools adhere to it. It is governed by the CNCF for vendor neutrality.
A typical trace (when viewed with Zipkin) may look like the following:
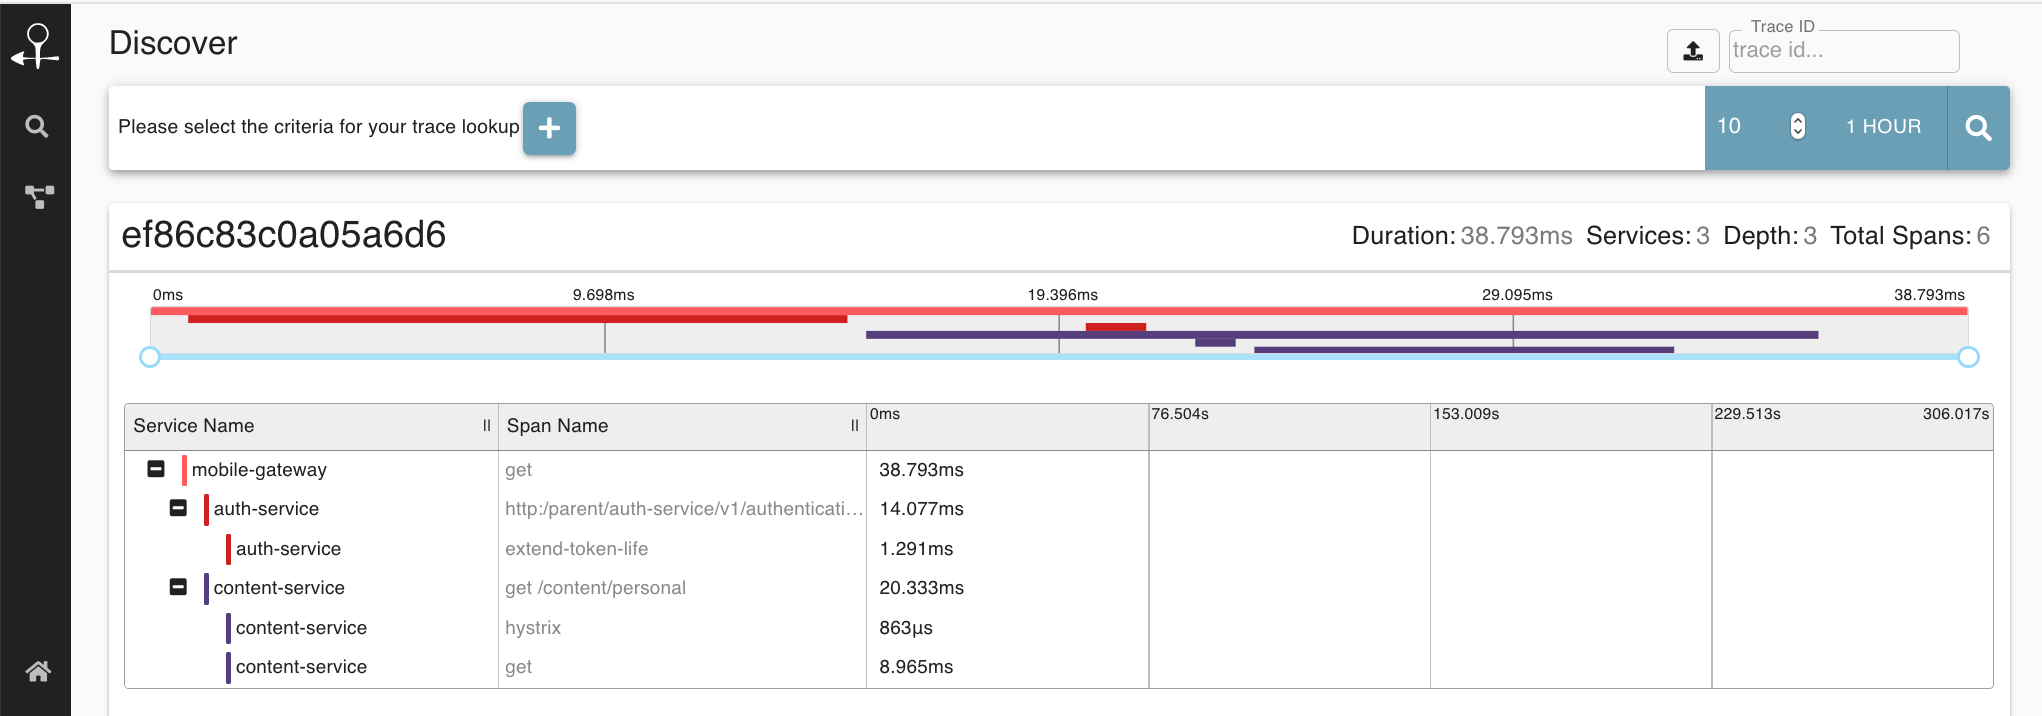
Zipkin and Jaeger are the most common tracing visibility tools.
Reasoning with Observability
As I’ve hopefully demonstrated, Observability is a mixed discipline. It uses different techniques to evaluate and offer visibility into a system and where possible, you should absolutely use a combination of each one. To demonstrate how they’re each used, let’s consider a practical example:
You’re woken up in the middle of the night, dazed and confused because your phone is going off. One of the rules in our monitoring triggers a phone call to an on call engineer when it sees the rate of 500 response codes from our metrics rise above a certain threshold. It just so happens you’re on call so you need to investigate it.
You log in to your monitoring system and first of all you check the alert. Looks like the system is right, you can see your metrics over time and you can confirm the rate of 500’s has gone up. But why?
You jump into the logging system and try and filter out (by time and response code) the messages your webserver logged. You can see the vast volume of 500’s but you haven’t actually logged anything useful - the error is uncaught. In search for a better error message, you try to load up the web page but it hangs for 60 seconds then 500’s. Weird. No useful error message, just an “Internal Server Error”.
You reason with this information and decide to look into your tracing. Viewing the span graph shows that requests to the backend are taking two minutes to complete. So you put it together and reason that the frontend is timing out before the backend can respond. The backend is obviously not expected to respond in this time, it should be much quicker - and typically is.
You switch back to your logs, see that the backend server is complaining about its available memory. It’s all starting to make more sense. You add some additional memory to the backend server, observe it starting to serve in a timely fashion and your frontend 500’s start going down and your incident is resolved. You go back to bed, but not before writing up the incident for a follow up the next day.
The next day, you look at how many steps it took to resolve the incident and see how you could have done it quicker:
- If you added a metric for your memory usage, you could write a rule to alert you when the memory pressure goes above 50%. This would have alerted you in advance so you could have provisioned extra capacity before the frontend served a single 500 and you annoyed your users.
- You make a change in your frontend server to catch the backend error and add some additional logging so you can quickly identify the same error occurring in the future.
Conclusions
As the example demontrates, you should continually be in a state of refinement. Your monitoring system can always be improved and expanded to different signals that together give you a complete picture of the health of your systems. To assist in the process, you can gather telemetry data from logs, metrics and traces. Each one can be leaned on as required to give you insight and assist you. You are on a continual journey to making the system more reliable in the future.
The rest of this series of articles will focus on metrics and I will dedicate attention to the other two pillars in their own series. In the next article, I will introduce you to Prometheus and Grafana as tools to collect and visualise your metrics. Be sure to subscribe to the RSS feed or join me on Twitter for follow ups.